Abstract
We measured the severity, distribution, and observed persistence of germline classification disagreement in three preserved ClinVar XML snapshots dated 31 August 2025, 2 March 2026, and 29 August 2026. Primary comparisons kept each variant’s complete condition-identifier set and inheritance context separate and required qualifying records from at least two independent organizations. The latest cohort contained 179,613 eligible units across 154,037 distinct variants. Direct positive-versus-benign disagreement occurred in 224 units (0.125%); any cross-band disagreement occurred in 32,684 units (18.197%). Adjacent-only differences formed a separate category of 34,003 units (18.931%). Follow-up of 29,626 baseline cross-band units identified 719 first observed eligible T0/T4 resolution states, including seven units that later returned to cross-band disagreement; 682 units lost comparable follow-up before an observed resolution. The findings distinguish disagreement severity and snapshot-observed change under explicit eligibility rules. They describe qualifying submitted records, not biological correctness, patient risk, true disagreement onset, or continuous persistence between archives.
The same variant, in the same context
ClinVar preserves submitted interpretations of genetic variants. Those records can differ because of uncertainty, evidence, clinical context, or classification practice. An atlas of disagreement needs to distinguish a direct opposition between pathogenic and benign interpretations from a difference involving uncertain significance or adjacent categories.1, 2
The primary comparison keeps the variant, the complete condition-identifier set, and the normalized inheritance context together. A variant submitted for two different conditions is not automatically a disagreement. Each eligible unit requires qualifying germline records from at least two independent organizations. Repeated submissions from one organization do not create additional organizational votes.7
The latest preserved XML snapshot is dated 29 August 2026. Under the primary eligibility rules, it contains 179,613 units across 154,037 distinct variants. These denominators describe qualifying submitted records. They are not counts of all ClinVar variants, tested patients, or a representative population.7
Positive classifications mean pathogenic or likely pathogenic; benign classifications mean benign or likely benign. Uncertain significance forms a separate band. T1 is direct positive-versus-benign opposition, T2 adds positive-versus-uncertain differences, and T3 captures uncertain-versus-benign differences. T4 describes adjacent differences within the positive or benign bands. The highest present tier assigns the unit’s category; T0 does not require identical source wording.2, 7
The definition changes the answer
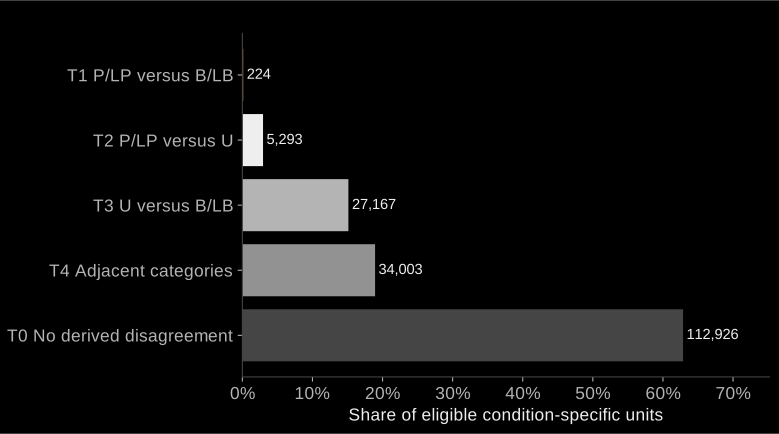
Direct positive-versus-benign disagreement is uncommon within this eligible cohort: 224 units, or 0.125%. Expanding the question to include positive classifications opposed by either benign or uncertain classifications gives 5,517 units (3.072%). Any difference across the positive, uncertain, or benign bands occurs in 32,684 units (18.197%).7, 8
These are nested definitions. The positive-versus-benign count is already included in the broader counts, so the first three rows should not be added together. Adjacent-only differences form a separate category: 34,003 units (18.931%). An adjacent-category difference is not direct positive-versus-benign opposition.7
The table reports unit-level estimates and variant-cluster bootstrap intervals from 2,000 resamples. Clustering retains the relationship between multiple eligible contexts for the same variant. These intervals describe the specified statistical model, not uncertainty about which submitted interpretation is biologically correct.7, 8
| Definition | Count / eligible denominator | Fraction | 95% interval |
|---|---|---|---|
| Positive versus benign | 224 / 179,613 | 0.125% | 0.109–0.141% |
| Positive versus benign or uncertain | 5,517 / 179,613 | 3.072% | 2.989–3.158% |
| Any cross-band disagreement | 32,684 / 179,613 | 18.197% | 18.004–18.387% |
| Adjacent categories only | 34,003 / 179,613 | 18.931% | 18.738–19.122% |
Counting distinct variants
Counting each distinct variant once changes the denominator to 154,037. There are 224 variants with direct positive-versus-benign disagreement (0.145%) and 31,161 with any cross-band disagreement (20.230%). A variant can contribute more than one condition–inheritance unit, which is why unit and variant fractions differ.7, 8
Variant categories use the highest observed severity across the variant’s eligible units. The adjacent-only variant count is therefore 31,073, rather than a count of every variant participating in any T4 unit. The intervals below use a Wilson superpopulation model, separately from the clustered model used for units.7, 8
Neither denominator measures a patient’s risk or the probability that a classification is wrong. ClinVar coverage is uneven, submissions are dependent, and primary eligibility excludes contexts with too few qualifying organizations.
| Definition | Count / eligible denominator | Fraction | 95% interval |
|---|---|---|---|
| Positive versus benign | 224 / 154,037 | 0.145% | 0.128–0.166% |
| Positive versus benign or uncertain | 5,207 / 154,037 | 3.380% | 3.291–3.472% |
| Any cross-band disagreement | 31,161 / 154,037 | 20.230% | 20.030–20.431% |
| Adjacent categories only | 31,073 / 154,037 | 20.172% | 19.973–20.374% |
What three snapshots can show
The preserved XML dates are 31 August 2025, 2 March 2026, and 29 August 2026. Across the three snapshots, the primary cohorts contain 159,438, 169,976, and 179,613 eligible units respectively. Growth in those totals reflects changing coverage and eligibility as well as changes in submitted classifications.7
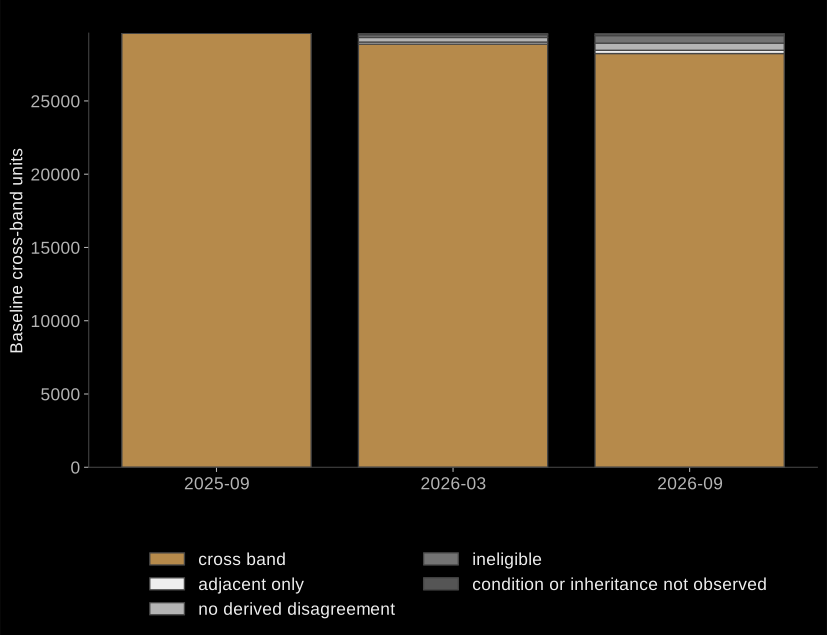
Historical follow-up starts with the same 29,626 baseline units showing cross-band disagreement. The time origin is the baseline observation of a prevalent disagreement—not its true onset. A later record is comparable only when its variant, condition, inheritance, and source context remain compatible.7
Across follow-up, 719 baseline units first reached an eligible T0 or T4 state: 452 by the March snapshot and another 267 at the final snapshot. Seven subsequently returned to cross-band disagreement. Consequently, the final observed endpoint contains 712 eligible T0/T4 states, while the cumulative first-observation count is 719. T4 can still contain adjacent-category differences.7
Another 682 units lost comparable follow-up before an observed resolution. The loss-to-follow-up sensitivity spans 2.427–4.729%; it does not bound every transient resolution or recurrence between archives. Three snapshots cannot establish continuous persistence, the cause of a change, or the correctness of the later interpretation.7
| Final observed state | Units |
|---|---|
| Cross-band disagreement | 28,232 |
| Adjacent-category difference (T4) | 225 |
| No classified disagreement (T0) | 487 |
| Ineligible comparison | 512 |
| Condition absent | 170 |
A smaller count can mean a lost comparison
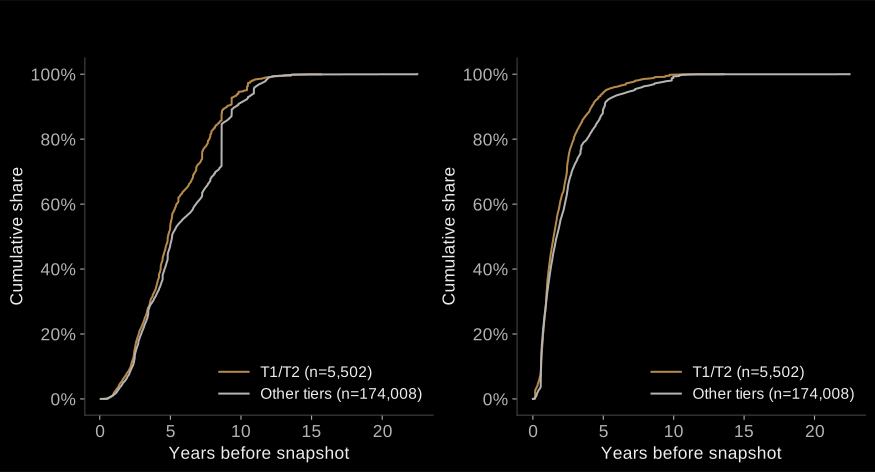
Evaluation dates offer another view of the records, but they do not identify how long a disagreement has existed. Evaluation age, record-update age, and the unknown duration of disagreement are different quantities. A unit enters an age curve when at least one valid age is available; dates are not required for every assertion.7
Restricting comparisons to assertions evaluated within two years leaves 2,296 of the original 32,684 cross-band units in a cross-band state. A further 929 become eligible T0/T4 comparisons. The remaining 29,459 have too few qualifying organizations after filtering.7, 9
Most of the reduction therefore comes from lost eligibility. Removing the second qualifying organization is not an observation of agreement. The age-filter result should be read as a change in the retained comparison set, not evidence that older assertions caused disagreement or that excluded units resolved.7
| After the two-year evaluation filter | Original cross-band units |
|---|---|
| Cross-band disagreement retained | 2,296 |
| Eligible T0/T4 comparison | 929 |
| Insufficient qualifying organizations | 29,459 |
| Original cohort | 32,684 |
Where the observed differences appear
Exploratory views describe genes, complete condition sets, organizations, and official RCV review-status strata. These views help locate the submitted-record differences; they do not establish their causes or identify classification error.7
The gene screen compares observed and expected T1/T2 counts for 691 adequately represented genes with complete leave-one-gene-out reference coverage. Both axes use symmetric logarithmic scaling, with a linear region from zero to one. The graphic is descriptive: it is not a significance ranking or a measure of disease risk.7
Review stars partly encode agreement. Differences across official review-status strata are therefore structurally dependent and cannot establish a causal effect of review. An observed zero rate in a stratum does not establish zero clinical risk.3, 7
Fractional participation uses separate denominators for genes, complete condition sets, and organizations. Participation does not attribute error. The condition-set view selects fifteen sets by their eligible-variant denominators; a variant may appear in more than one set, and source descriptions are not clinical reinterpretations.7
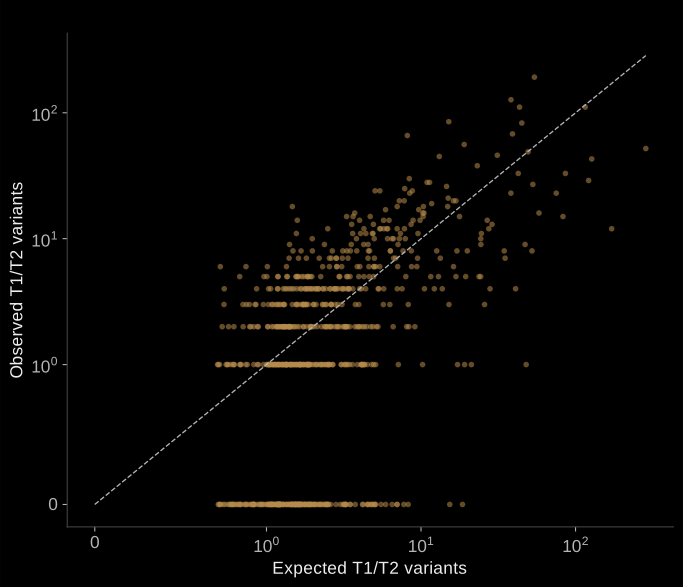
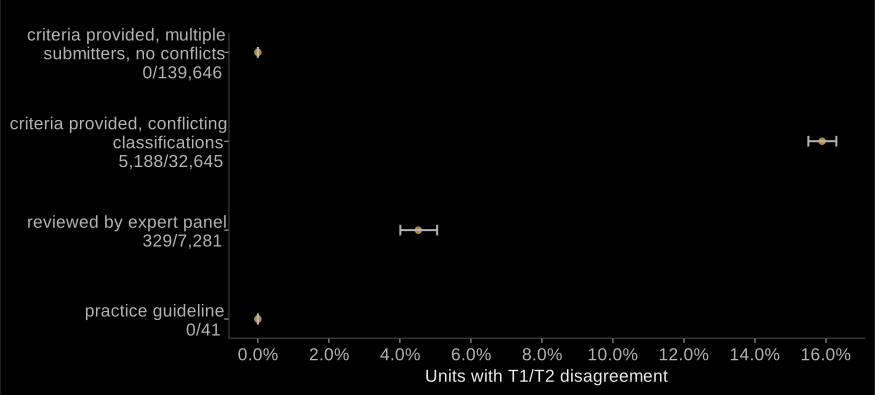
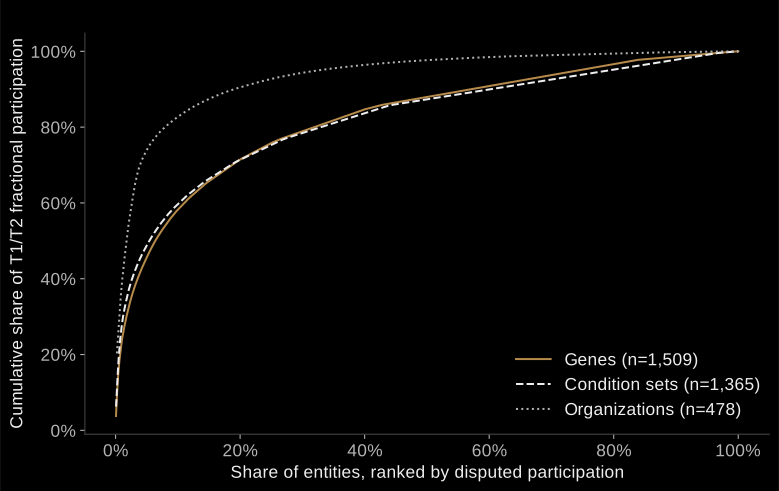
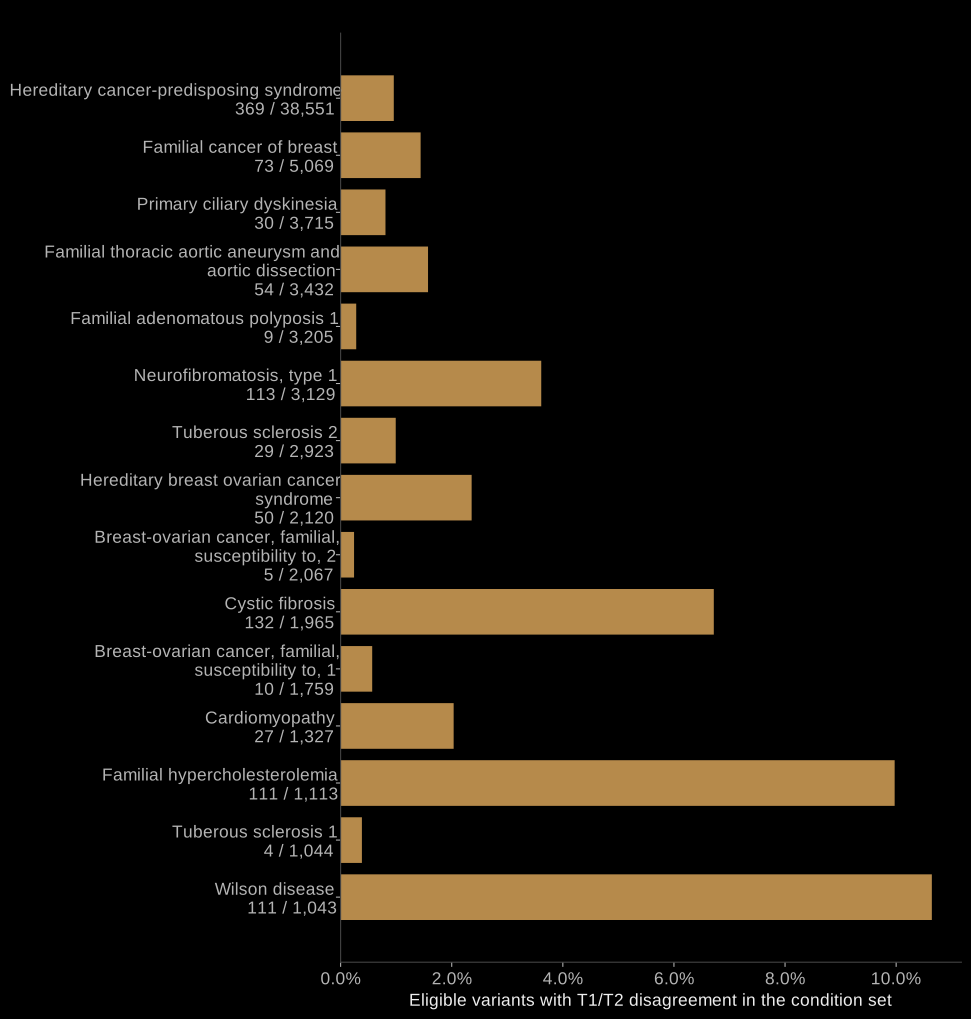
Figure 1 of 4: Descriptive observed-versus-expected gene-level T1/T2 counts
From preserved sources to inspectable results
The analysis is bound to 24 dated inputs: matched VCV/RCV XML, tabular exports, a current-snapshot GRCh38 VCF, schemas, and documentation. Retrieval URLs, byte sizes, and SHA-256 hashes identify the exact retrieved inputs. XML dates, release labels, posting dates, and retrieval dates remain distinct. Original-distribution byte identity has not been independently established.1, 6, 7
One protocol and four dated addenda preserve the study rules and their provenance. This is internal prespecification, not external registration. A historical source-quality restriction was added after outcome inspection and is disclosed as such. Twelve sensitivities examine alternative choices without replacing the primary definition.7
A separate literal SQL implementation reconstructs primary units and tiers and agrees exactly over shared normalized inputs. The replay completed 53 source-to-export stages plus two review-status supplements. Exact export comparisons and pinned scientific dependencies connect the executed code to the preserved results.7
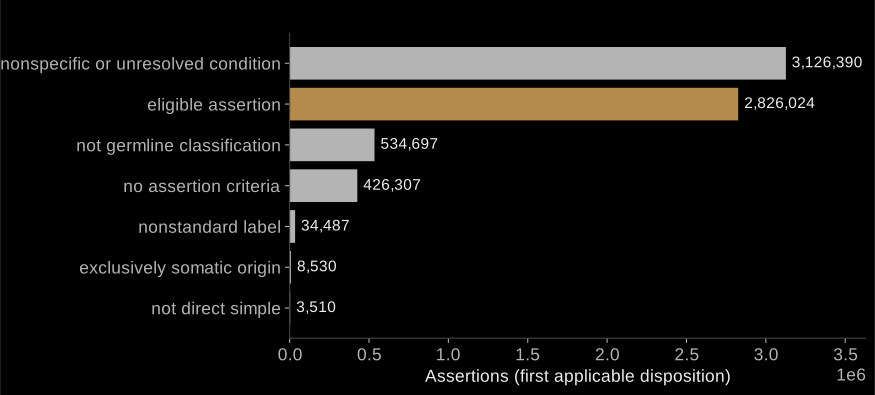
The producing workflow also checked 120 prespecified cases against separately extracted raw VCV fields and actual RCV membership. These are computational and source checks within the producing workflow, not independent expert or clinical review. The assertion-disposition figure describes the first applicable reason an extracted assertion passes or fails; passing assertion filters does not itself establish final multi-organization unit eligibility.7
The 1,143 VCF representation differences remain recorded among 4,468,152 comparisons. Their 27 eligible primary units remain in the XML-based cohort. Source-field agreement does not establish reference-aware allele normalization. The limited official-rule approximation found 29 nonnull disagreements and 5,961 undecidable VCV/RCV aggregate-record comparisons; it is not validated replication of official aggregation rules.7
Supplementing the two proven baseline RCV-only assertions leaves primary eligibility unchanged. In the focused variant-wide sensitivity, VariationID 978268 gains one eligible T4 unit; the other evaluated definitions are unchanged. This secondary result remains separate from the primary estimates.7
What the evidence can tell us
The strongest claims concern these preserved eligible records: the distribution of disagreement severity, snapshot-observed persistence and state changes, and exact computational agreement under the frozen inputs and code. The research does not identify which classification is biologically correct.7
Uneven archive coverage, dependent organizations and records, changing eligibility, incomplete evaluation dates, and sparse historical observations limit interpretation. Exploratory associations do not establish causation. Some source discrepancies remain unexplained, and unobserved events between archives cannot be excluded.7
No independent human, expert, clinical, or journal peer review has been completed. The report is neither clinical guidance nor a deployed clinical atlas, and it does not claim a field-first discovery of classification disagreement. Reproducibility makes the calculations inspectable; it does not turn them into a clinical verdict.
Examine and reproduce the research
The complete version 1.0.1 manuscript contains the methods, results, eight figures, source examples, limitations, and references. The curated inspection package includes public analysis code and its lockfile, dated protocol provenance, selected exact result tables, the source-fetch manifest, figure masters, and computational receipts.7, 8, 9, 10
The package is not a raw-data mirror or the complete sealed research archive. Reproduction requires downloading the manifest-matched source files. Raw archives, private operational records, internal publication machinery, and linked full-text works are excluded. Earlier unpublished editions remain preserved.10
The file manifest identifies each packaged file and its checksum. Replay instructions explain the required sources and execution order. Source attribution and reuse terms preserve the applicable rights; the package does not assign a blanket new license to third-party content. Live ClinVar links may show classifications later than those in the preserved snapshots.5, 10, 11
Sources and further reading
Study documentation and exact computed tables support the numerical claims. ClinVar documentation explains source semantics and does not independently endorse these results. Live database pages may contain later records than the preserved archives.
Study materials
- Source 7. NAS-CVA-001 version 1.0.1 manuscript
NaS Research · 2026 · Version 1.0.1
Study methods, results, provenance, and limitations
- Source 8. Exact principal-estimate table
NaS Research · 2026 · Exact computed estimates
Numerators, denominators, interval models, and exact estimates
- Source 9. Age-filter retention table
NaS Research · 2026 · Exact computed retention states
Retained states and eligibility loss
- Source 10. Curated inspection package
NaS Research · 2026 · Version 1.0.1
Public code, protocols, selected evidence, and figure masters
ClinVar and methods documentation
- Source 1. ClinVar download and identifier guide
NCBI · ClinVar documentation
Source formats and archive identifiers
- Source 2. ClinVar classification representation
NCBI · ClinVar documentation
Source classification semantics
Published research
- Source 4. ClinVar: updates to support classifications of both germline and somatic variants
Landrum MJ et al. · 2025 · Nucleic Acids Research 53(D1), D1313–D1321
Database context
Attribution and reuse
- Source 11. Source attribution and reuse terms
NaS Research · Source rights and use limitations
Applicable source rights and use limitations
Publication details
Cite this work
NaS Research (2026). The ClinVar Conflict Atlas. NaS Research. Version 1.0.2. https://nasresearch.bio/research/clinvar-conflict-atlas
Download data and analysisNAS-CVA-001, web version 1.0.2. Public web edition of the computational research report. The PDF remains a fixed review-candidate edition. No independent human, expert, clinical, or journal peer review has been completed. Computational verification does not establish biological correctness. Earlier unpublished editions remain preserved.
Presentation update: cover artwork loops automatically without play/pause controls. Scientific content, results, and the PDF edition remain unchanged.