Summary
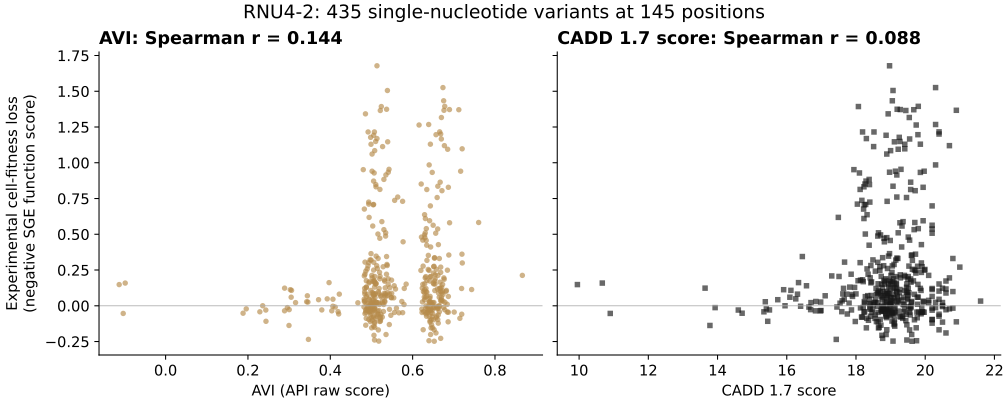
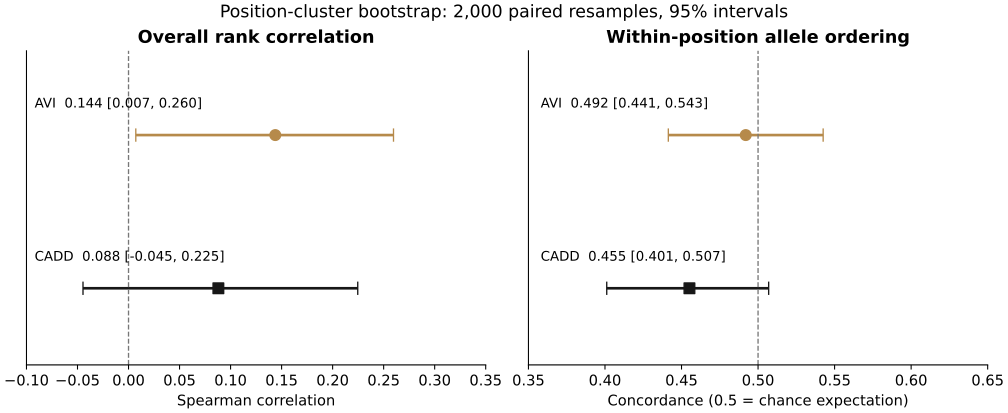
We compared AlphaGenome Atlas AVI scores with published saturation genome editing measurements for 435 single-nucleotide variants across the 145-base RNU4-2 transcript. AVI showed a weak positive rank correlation with experimental cell-fitness loss (Spearman r = 0.144). CADD 1.7 scored 0.088. The paired difference interval included zero. Within-position allele concordance was 49.2%, close to its 50% chance expectation. These results provide no clear evidence of better ranking than CADD in this assay. This focused result is consistent with a limitation already discussed by the Atlas authors [2, p.18].
- Research area
- Computational Genomics
- Document type
- Research Note
- Version
- 1.2
Question
Does AVI track measured variant effects in a non-protein-coding RNA, and does it distinguish alternate changes at the same position? Overall correlation can reflect differences between genomic regions. Within-position ordering asks a narrower question about allele discrimination.
Results
The primary comparison includes 435 transcript variants at 145 positions. All variants had an AVI score. The difference intervals include zero, so this analysis does not establish superior ranking by AVI over CADD. These are rank-based comparisons, not diagnostic accuracy estimates.
| Metric | AVI | CADD 1.7 | AVI minus CADD |
|---|---|---|---|
| Spearman correlation | 0.144 [0.007, 0.260] | 0.088 [-0.045, 0.225] | 0.056 [-0.033, 0.137] |
| Within-position concordance | 49.2% [44.1, 54.3] | 45.5% [40.1, 50.7] | 3.7 [-3.7, 10.9] pp |
Data and methods
We used the final published Supplementary Table 1 from De Jonghe et al. (2026) [1]. Of 539 engineered edits, 453 were SNVs. The primary cohort comprised all 435 transcript SNVs; 18 downstream SNVs were reserved for a prespecified sensitivity analysis and 86 other edits were excluded. Every forward-strand hg38 reference allele matched the UCSC reference sequence [4]. All 453 AVI scores were retrieved through the authenticated official Atlas client on 9 September 2026 UTC; no scores were missing. The endpoint was negative function_score_mean, representing cell-fitness loss. The comparator was CADD 1.7 from the same source table. We used the API raw AVI score, not a clinical or PHRED cutoff. Spearman correlation is invariant to strictly increasing score transformations.
Uncertainty and allele ordering
For the within-position metric, we compared all three pairs of alternative alleles at each site. Correct ordering scored 1, reversed ordering 0, and prediction ties 0.5; pairs tied experimentally were excluded. Site averages received equal weight. We used 2,000 paired bootstrap resamples of positions, preserving each site’s alternate alleles, with seed 20260909. Intervals are percentile 95% intervals conditional on this one assay. We did not tune scores, fit a model, select a clinical threshold, or optimize the cohort against results.
Sensitivity analysis
Including all 453 SNVs yielded AVI r = 0.172 and CADD r = 0.120. The paired difference was 0.052 [-0.028, 0.131]. This did not materially change the interpretation. Secondary all-SNV allele-ordering estimates are retained in results.json but are not promoted as a separate confirmatory finding.
Interpretation and limits
The correlation of 0.144 describes rank agreement; it is not 14.4% accuracy. Similarly, 49.2% is a within-site pair-ordering statistic, not clinical classification accuracy. The data suggest limited rank agreement for this RNA and experimental endpoint. The near-chance allele ordering highlights a limitation that an overall correlation alone could obscure. However, tiny differences in experimental measurements can reverse allele order; our ordering metric does not incorporate replicate-level measurement uncertainty. Nearby sites may also be dependent, beyond the clustering captured by the bootstrap. HAP1 cell fitness is not patient severity, clinical pathogenicity, or performance across all non-coding variants. Failure to establish an advantage is not proof that the methods are equivalent.
Relationship to previous work
Google's Atlas preprint explicitly identifies RNU4-2 as an example of a training-data gap: standard poly(A)-selected RNA sequencing excludes non-polyadenylated noncoding RNAs [2, p.18]. This is a plausible context for our result, not a mechanism established by this analysis. The authors report the highest Spearman correlation in eight of ten held-out SGE screens [2, p.5]; strong aggregate performance does not imply equal performance in every gene or assay. They already evaluate RNU4-2 [2, Methods p.28]. Our work is a focused reanalysis of an existing screen, not a first benchmark or new independent experimental validation. We used the final 2026 source table and did not reproduce Google's exact filtered input snapshot. The analysis plan was internally frozen before AVI retrieval, not externally preregistered. We do not establish that Atlas is broadly inaccurate or contradict Google's aggregate performance claims.
Reproducibility and review
Deterministic code produced all numerical results. Independent formulations reproduced the point estimates; source-value comparisons, input hashes, and exact bootstrap replay passed. Public experimental data and the free non-commercial API were used. No patient-level records or paid data services were required. NaS Research prepared this report with AI assistance. A separate computational audit checked every source field, score, coordinate, estimate, and interval. This is AI-assisted verification, not external expert review or peer review. No clinical recommendation is made. Reproduction files accompany the web edition.
Sources and further reading
Experimental measurements, model methods, reference coordinates, and output terms are documented in the sources below. Links open in a new tab.
- [1] De Jonghe et al. (2026). Saturation editing of RNU4-2 reveals distinct dominant and recessive disorders. Nature.
- [2] Cheng et al. (2026). AlphaGenome Atlas preprint, Discussion p.18; evaluation pp.5 and 28.
- [3] Google DeepMind. AlphaGenome Atlas API reference.
- [4] UCSC Genome Browser API. hg38 reference, chr12:120291752-120291903 (0-based half-open).
- [5] AlphaGenome Output Terms of Use.
Citation
NaS Research (2026). AlphaGenome Atlas in RNU4-2: a focused computational benchmark. NaS Research. Version 1.2. https://nasresearch.bio/research/alphagenome-atlas-rnu4-2
Research note v1.2, published September 9, 2026. The PDF is the fixed version of record. Earlier v1.0 and v1.1 drafts were not public. This edition adds an expanded AI-assisted computational audit; all numerical results are unchanged. Computational verification is not external expert review or peer review. The public package includes the matched data, frozen analysis, audit receipt, and numerical replay instructions.