
Summary
A strong benchmark score does not establish reliability on chemically different molecules. Across 300 model runs, we audited TDC BBB_Martins, controlled the similarity between training and test chemistry, and evaluated confidence-based selection on external data. Conservative curation retained 1,935 of 2,030 reference rows without verified biological relabeling. Morgan logistic regression AUROC was 0.913 on grouped-random tests and 0.732 under strict separation, a contrast involving different test populations. With test rows, training size and class balance held fixed, allowing closer training chemistry raised its mean AUROC from 0.816 to 0.869. On 428 conservatively filtered external records, an illustrative validation-fixed confidence policy reduced accepted error from 12.34% to 5.55% at 74.95% coverage. Accepted specificity remained 52.90%; class-standardized accepted error was 8.31%. No evaluated policy met the complete usefulness criterion on the 244-record distant subset. These results support reporting class retention and domain limits alongside aggregate performance.
From benchmark scores to prediction reliability
When can a blood-brain barrier benchmark support a useful prediction claim? We audited source versions and molecular integrity, then tested whether model comparisons and selective prediction remained informative after changes in chemical composition. The work combines an eight-design benchmark audit with a controlled and external follow-up in NAS-BBB-001.
The audit completed 200 model runs and the follow-up completed 100. The polar-surface rule fits calibration rather than a learned molecular representation. Five repeated seeds do not constitute five independent external datasets. The contribution is a reproducible assessment of evidence boundaries, including negative-class retention and chemical distance, rather than a new biological mechanism or a new model architecture.
Prior work already addresses BBBP curation, benchmark inconsistency, overrepresentation and uncertainty-based rejection [3,4,6,7]. This study is a replication and extension; an exhaustive novelty claim is not made.
One question, three tests
- 01 · AuditDoes the test change the score?
Reconstruct source versions and compare eight evaluation designs.
200 model runs - 02 · ControlWhat changes with closer chemistry?
Keep test rows, training size and class balance fixed within each seed.
75 model runs - 03 · TransferDoes the benefit carry over?
Evaluate external records, then measure error and class retention when predictions are withheld.
25 model runs
The follow-up tests the interpretation of the benchmark, not just its headline score.
Dataset provenance and integrity
The reconstructed version chain contains 2,053 deposited Martins records, 2,050 MoleculeNet rows, 2,039 TDC download rows and 2,030 TDC loader/official-union records [1,2,12]. The official union comprises 1,624 development and 406 test rows. The historical count of 1,970 curated molecules remains unresolved.
The reference contains 1,975 unique canonical structures, 52 repeated canonical groups and 10 canonical label-conflict groups involving 20 rows. Broader conservative curation retained 1,935 representatives. Across all 2,030 rows, dispositions were 1,935 retained, 49 duplicate members, 25 conflicting representations, 20 ambiguous organic mixtures and one standardization instability.
Canonical, neutral-parent, tautomer and stereo-free representations were retained for audit. Stereo-free matching is a conservative grouping convention, not proof of chemical identity. Curation used distributed labels to identify contradictions before splitting; it is retrospective and label-informed. No biological label correction was verified.
| Source or cohort | Records | Interpretation |
|---|---|---|
| Martins deposit | 2,053 | Deposited source |
| MoleculeNet | 2,050 | Three omitted source rows have retained matches |
| TDC download | 2,039 | Parsable structure/label multiset |
| TDC loader / official union | 2,030 | Nine identical full rows removed |
| Integrity cohort | 1,935 | Conservative eligible representatives |
From deposited records to the analysis cohort
- 2,053Martins deposit
- 2,050MoleculeNet
- 2,039TDC download
- 2,030TDC loader
- 1,935Integrity cohort
49 duplicate members · 25 conflicting representations · 20 ambiguous mixtures · 1 unstable standardization
Evaluation design
The original audit used five fixed seeds across eight designs: reference row-random, reference scaffold, official fixed test, integrity grouped-random, integrity grouped-scaffold, similarity below 0.6, strict similarity below 0.4, and official integrity evaluation. Base groups joined stereo-free tautomer matches and Morgan Tanimoto similarities at least 0.9; additional scaffold or similarity edges formed transitive connected components.
GroupShuffleSplit held out 20% of groups for test, then 12.5% of remaining groups for validation. These are group fractions, not record fractions. No seed was retried for favorable balance. Strict test sizes ranged from 180 to 877 records. Such designs change sample size, prevalence and chemistry together and cannot isolate a causal leakage effect.
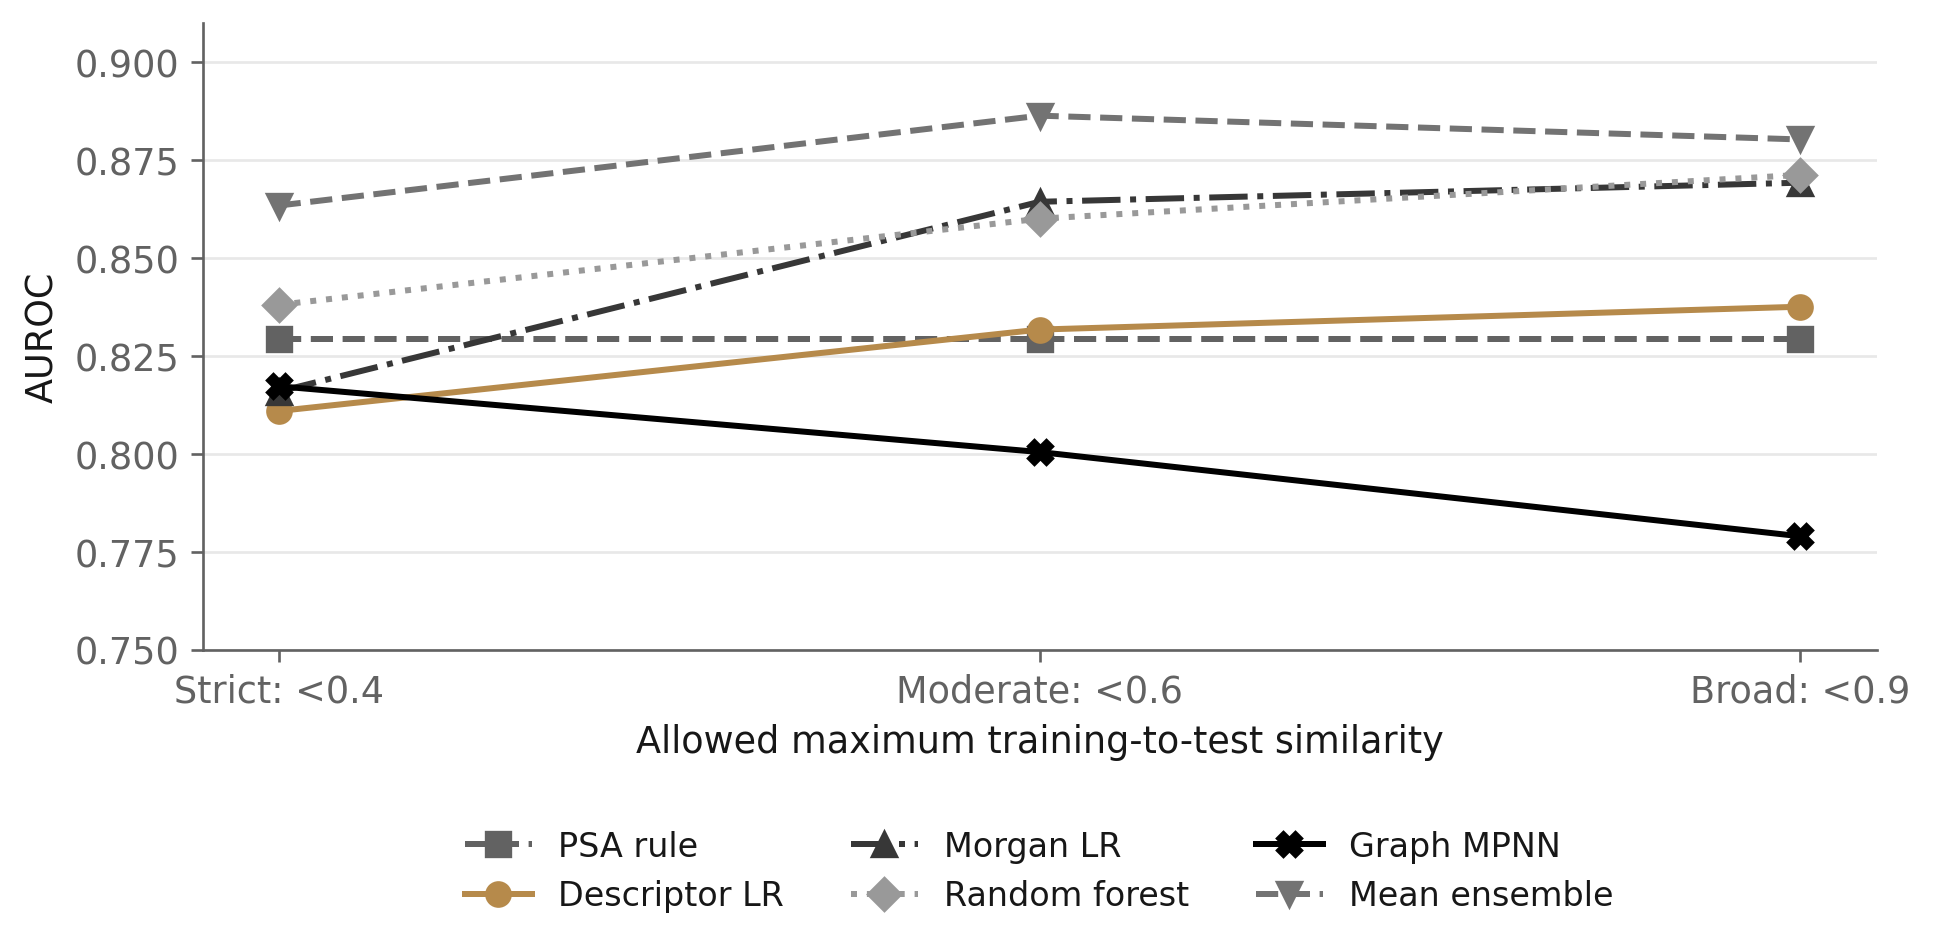
The follow-up held test and validation rows fixed within seeds 21-25. Each condition used 300 training records (150 per class), 100 test records (50 per class), 40 model-validation records and 40 separate policy-validation records. Strict, moderate and broad similarity restrictions changed the sampled training chemistry while holding training size and class balance fixed.
External training used grouped original-data splits of approximately 64% training, 16% model validation and 20% policy validation. No external labels were used to fit models, calibrate probabilities or set retention cutoffs. Protocols were locally dated, frozen and hashed; they were not publicly preregistered or independently timestamped. Earlier feasibility and audit outcomes were known when the respective protocols were written.
Models and probability calibration
Five fixed predictors were evaluated: a polar-surface rule, descriptor logistic regression, Morgan logistic regression, random forest and a small graph message-passing network. The follow-up also used an unweighted mean of their calibrated probabilities. No hyperparameter search or pretrained graph model was evaluated.
The rule is sigmoid((90 - TPSA) / 20), an explicit heuristic rather than a validated permeability equation [9]. Descriptor logistic regression uses molecular weight, logP, TPSA, hydrogen-bond donors and acceptors, rotatable bonds, ring count and fraction sp3 with training-only standardization. Both logistic models use C=1, liblinear and a 2,000-iteration limit. Morgan inputs are radius-2, 2,048-bit fingerprints without chirality. The forest uses 300 trees, minimum leaf size 2, square-root feature sampling and no class weighting.
The graph model has 23 atom features, 12 bond features, three 64-dimensional message/update layers, GRU updates, mean-plus-sum graph readout and 99,521 parameters [8]. Adam uses learning rate 0.001, weight decay 0.0001 and batches of 64. Training lasts at most 60 epochs, with patience 10 on validation log loss and restoration of the best checkpoint.
All predictors receive validation-only sigmoid calibration with a nonnegative slope (bounded 0-100) and free intercept (bounded -100 to 100). Classification uses calibrated probability at least 0.5. Graph early stopping and calibration share the model-validation set. This reuse and the fixed, untuned architecture limit model-family comparisons.
Four retention scores favor acceptance: confidence max(p, 1-p), nearest-training fingerprint similarity, negative standard deviation across the five calibrated predictors, and the equal average of validation empirical percentile ranks of those three scores. Percentile maps and quantile thresholds use only policy-validation records. Thresholds target nominal coverage of 50%, 75% and 90% and are applied unchanged to test and external records. Ties and distribution changes can alter achieved coverage; actual coverage is reported.
Audit results: scores depend on the test
Morgan logistic regression mean AUROC was 0.897 under row-random evaluation, 0.830 on the original official test, 0.913 under integrity grouped-random evaluation and 0.732 under strict chemical separation. These are descriptive contrasts between changing populations, not estimates of a single causal leakage effect.
Under strict separation, the graph model exceeded Morgan logistic regression by 0.051 AUROC. Its conditional 95% interval was 0.021-0.081 under the original resampling and 0.016-0.086 under the exploratory shared-group sensitivity. The forest gain was 0.035; its interval changed from 0.001-0.064 to -0.001-0.071 after accounting for repeated group appearances. The forest advantage was therefore sensitive to the overlap treatment.
The simple polar-surface rule had higher strict-distance mean AUROC than the graph model (0.812 versus 0.782). A gain over Morgan logistic regression does not demonstrate general superiority of complex models. Validation calibration improved Brier score in 116 of 200 runs, illustrating that improved probability error does not automatically transfer to every evaluation population.
| Strict-distance model | AUROC | Brier | Specificity |
|---|---|---|---|
| PSA rule | 0.812 | 0.143 | 0.424 |
| Descriptor LR | 0.812 | 0.144 | 0.413 |
| Morgan LR | 0.732 | 0.182 | 0.226 |
| Random forest | 0.767 | 0.167 | 0.453 |
| Graph MPNN | 0.782 | 0.155 | 0.412 |
Controlled comparison: equal-size, fixed-test evaluation
Allowing closer training chemistry raised Morgan logistic regression AUROC from 0.816 to 0.869. The broad-minus-strict contrast was +0.053 (pointwise 95% interval +0.023 to +0.087). The forest rose from 0.838 to 0.871. The PSA rule stayed at 0.829, as expected with identical test and calibration rows.
The graph model changed from 0.817 under the strict restriction to 0.779 under the broad restriction. In the broad condition its AUROC was 0.059 below descriptor logistic regression; the interval adjusted for three planned model comparisons was -0.105 to -0.009. This result concerns this implementation and data regime, not all graph networks.
The mean of per-seed median nearest-training similarities was 0.290, 0.363 and 0.384 for strict, moderate and broad conditions. Equal counts and prevalence address two confounders, but the sampled training chemistry still differs. Broad-minus-strict contrasts are exploratory diagnostics; primary planned contrasts compare models within conditions.
External cohorts and overlap exclusions
All external candidates were screened against all 2,030 original source rows, including rows excluded from the integrity cohort. Canonical, neutral-parent, tautomer and stereo-free matches were excluded, followed by Morgan similarity at least 0.9. Conflicts, mixtures, duplicates, standardization failures and cleanup idempotence were checked.
Of 527 Tong S-data candidates [4,10], 428 remained: 353 positive and 75 negative. Exclusions comprised 74 representation matches (45 tautomer and 29 additional stereo-free tautomer matches), 14 additional near matches, nine ambiguous organic mixtures, one duplicate and one standardization failure. These representation matches are not all proven identical molecules.
The nested distant S-data subset contains 244 records (213 positive, 31 negative), each with maximum similarity below 0.4 to the entire original pool. It is not another independent dataset. S-data combines endpoints and inferred annotations and lacks row-specific assay mapping in the released file. Independently assembled records therefore do not establish independent experimental measurements.
Two secondary B3DB cohorts [5,11] retained 115 records (113 positive, two negative) and 139 records (120 positive, 19 negative). Both failed the frozen minimum of 20 records per class for strong comparative discrimination claims. Literature-year and source-lineage exclusions do not resolve assay independence.
| External cohort | Candidate rows | Retained positive / negative |
|---|---|---|
| S-data: primary | 527 | 353 / 75 |
| B3DB recent | 175 | 113 / 2 |
| B3DB quantitative | 175 source-filtered | 120 / 19 |
External performance: ranking is not negative-class reliability
On the 428-record primary holdout, none of the three planned AUROC model differences excluded zero after adjustment. The ensemble had the highest descriptive mean AUROC, 0.881, but ensemble superiority was not a planned paired hypothesis.
On the distant subset, graph-minus-descriptor AUROC was -0.095 (adjusted interval -0.184 to -0.016). Descriptor AUROC of 0.862 coexisted with specificity of only 0.200 at threshold 0.5. Thus a strong ranking score can coexist with poor classification of negative records.
| Model | AUROC | Sensitivity | Specificity |
|---|---|---|---|
| PSA rule | 0.851 | 0.981 | 0.365 |
| Descriptor LR | 0.870 | 0.985 | 0.368 |
| Morgan LR | 0.796 | 0.925 | 0.563 |
| Random forest | 0.849 | 0.960 | 0.499 |
| Graph MPNN | 0.843 | 0.926 | 0.547 |
| Mean ensemble | 0.881 | 0.981 | 0.467 |
Selective prediction: less error, with a changed retained population
Four retention scores and a deterministic random baseline were assessed at three nominal validation coverage levels for six predictors. Cutoffs were fixed on separate original-data policy-validation records. The complete analysis reports 810 population/policy summaries and 4,050 per-seed selective evaluations.
The descriptor-confidence policy at nominal 75% coverage retained 74.95% of external records. Mean accepted error was 5.55%, compared with 12.34% at full coverage: a 6.79-percentage-point reduction (pointwise conditional 95% interval 4.60-9.20). This example was chosen for discussion after outcomes were available; it is not a prospectively confirmed or deployment-selected policy.
Mean retention was 80.23% of positives and 50.13% of negatives. Accepted specificity was 52.90%, while sensitivity was 99.93%. Every seed retained at least 34 negative records. Restoring the original class mixture gave 8.31% standardized accepted error. This descriptive reweighting does not estimate performance on rejected molecules.
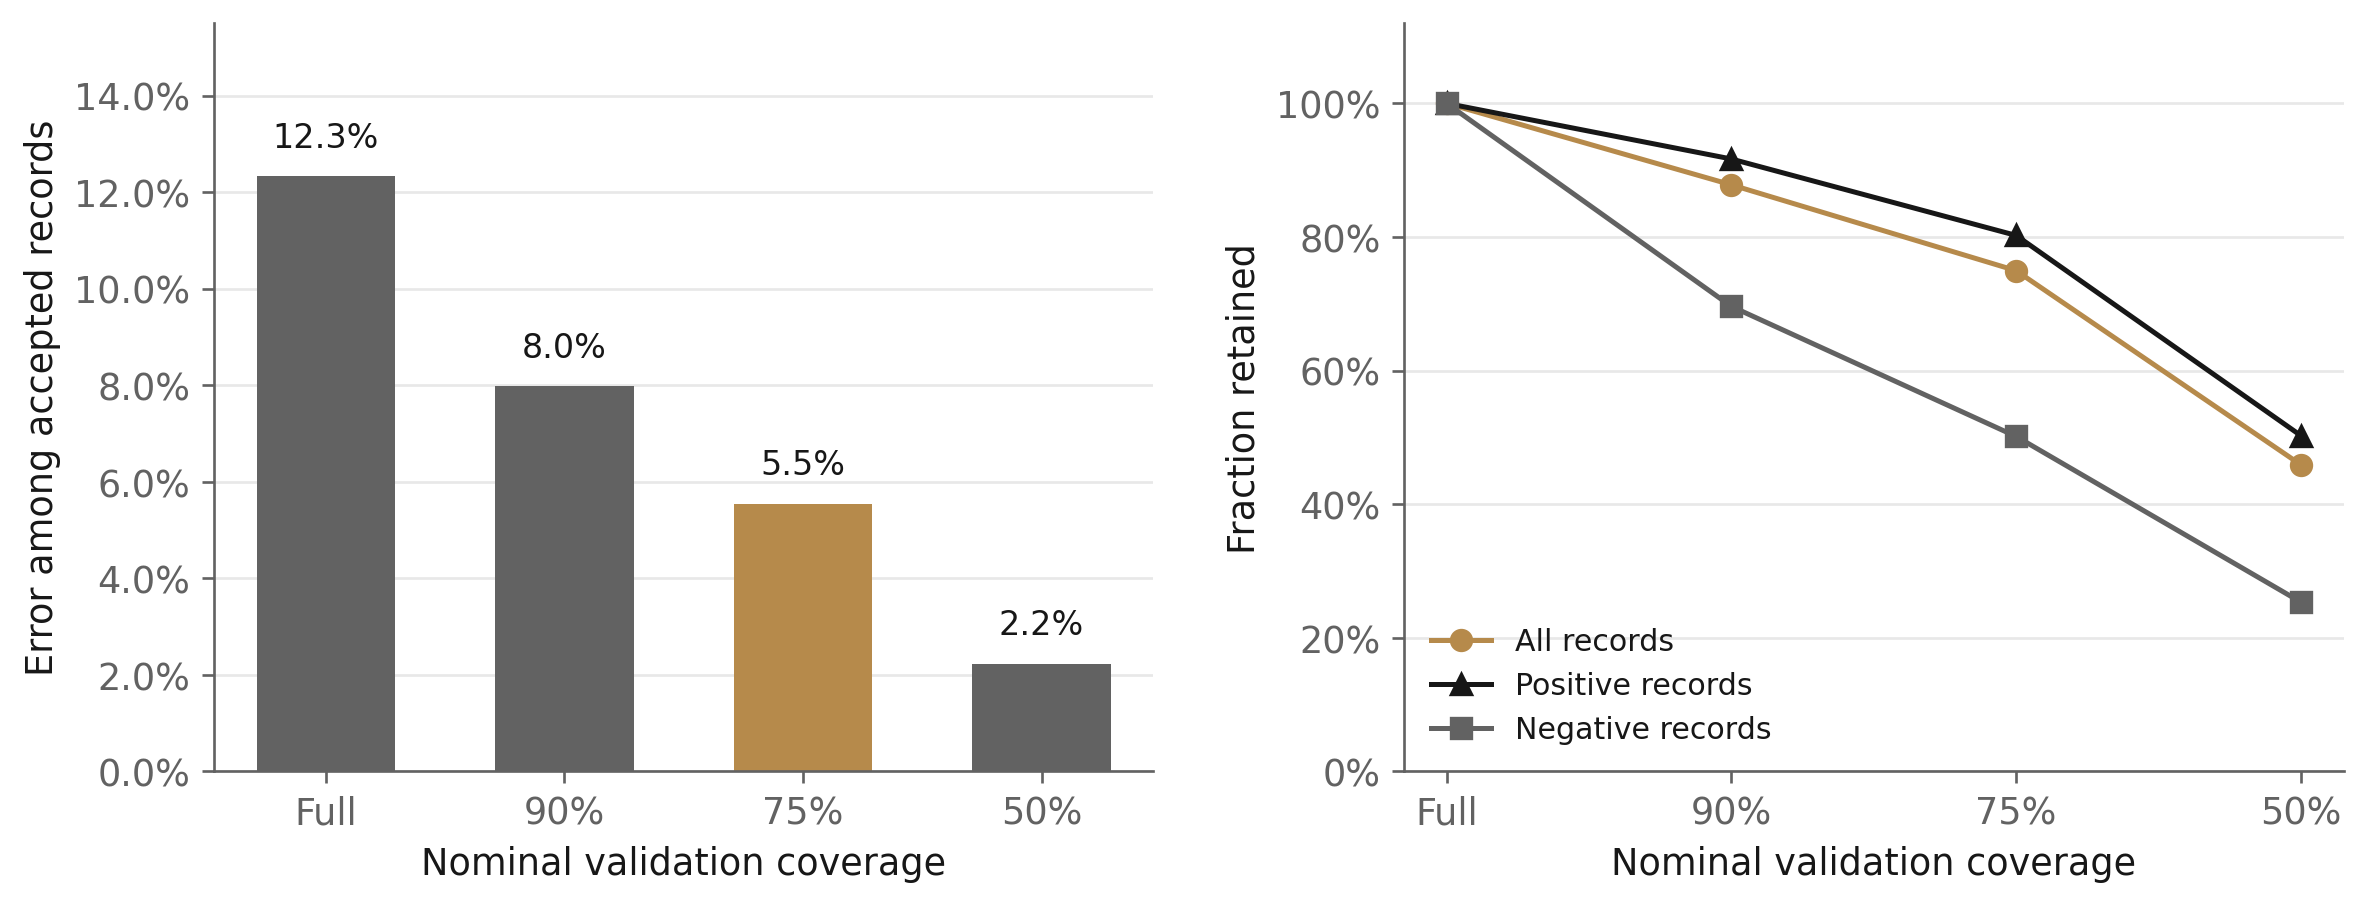
Lower accepted error. Uneven class retention.
Which records were retained?
Accepted specificity was 52.90%. Reweighting to the original class balance gave 8.31% accepted error.
Usefulness criteria and the complete policy grid
The frozen research criterion required at least five percentage points less error, at least 50% overall coverage, at least 30% each-class coverage, at least 20 accepted records per class, and a positive paired 95% lower bound. Implementation used mean overall coverage across seeds, while each-class coverage and counts had to hold in every seed. A numerical safeguard requiring at least 950 valid bootstrap replicates was added in implementation and was not in the frozen protocol.
All 90 primary S-data settings, including random baselines, had 1,000 valid replicates, so the numerical safeguard changed no primary decision. Among the 72 nonrandom primary settings, 22 passed the implemented criterion. A disclosed post hoc sensitivity requiring at least 50% overall coverage in every seed reduced this count to 21. No distant S-data setting passed under either interpretation.
The external cohort is 82.48% positive, so a constant-positive predictor already has high aggregate accuracy. Under the illustrative policy, the mean constant-positive error on the retained class mixture was about 11.71%, compared with 5.55% for the fitted model. Neither result removes the weak negative-class performance.
Confidence retention outperformed random retention descriptively (12.70% error at 74.35% coverage) and similarity-only retention (12.60% error at 38.18% coverage) in this example. Actual coverages differ, so these are not matched-coverage causal effects. Screening a large policy grid introduces multiplicity; pointwise intervals do not establish independent discoveries.
| Population | Original criterion | Every-seed coverage sensitivity |
|---|---|---|
| S-data | 22 / 72 | 21 / 72 |
| Distant S-data | 0 / 72 | 0 / 72 |
| Controlled broad | 7 / 72 | 6 / 72 |
| Controlled moderate | 15 / 72 | 14 / 72 |
| Controlled strict | 11 / 72 | 9 / 72 |
Statistical analysis and verification
AUROC, average precision, balanced accuracy, sensitivity, specificity, Matthews correlation coefficient, Brier score, log loss and 10-bin equal-width calibration error were computed from saved probabilities. Single-class metrics remained undefined. Classification used threshold 0.5. All displayed main results are means across five fitted seeds.
Molecular-group bootstrap intervals used 1,000 resamples with paired weights across predictors. The follow-up used shared weights for repeated appearances of each group. Intervals condition on fitted models and observed groups, not full retraining, new assays or new laboratories. Main follow-up comparison intervals were adjusted within each metric/population across three planned contrasts, not across all metrics, cohorts and analyses. Policy intervals remain pointwise and exploratory.
The follow-up metrics matched 2,430 independent scikit-learn calculations; the weighted bootstrap kernel passed 40 additional checks. A fresh release-stage replay reconstructed inputs and retrained all 100 follow-up runs. Non-forest calibrated outputs reproduced exactly. Forest calibrated differences reached 7.48e-8.
One forest similarity-policy selective log-loss result on three accepted distant records differed by 1.47e-7, exceeding the earlier 1e-7 aggregate precision gate. The same value recurred in a derived diagnostic. The exception was traced and disclosed; all retention, classification and usefulness decisions were unchanged. These checks establish numerical consistency within the archived computational workflow.
Interpretation and limitations
The useful finding is an evaluation requirement: report who is retained, how each class performs, and whether benefits survive chemical shift. An apparently favorable accepted-error rate can partly reflect removing difficult negatives. The controlled experiment strengthens interpretation beyond the original changing-population comparison, but does not identify a universal model-family effect.
Binary BBB annotations combine heterogeneous measurements and inferred labels. They are not interchangeable with unbound brain exposure, target engagement or clinical efficacy. Species, assay, concentration, transporter and exposure metadata are often unavailable. Conservative representation exclusions can remove related but distinct compounds; no evidence here adjudicates the true biological label of every conflict.
Additional limits include retrospective label-informed curation, transitive grouping, small validation sets, five jointly varying split/training seeds, one untuned graph architecture, conditional intervals, a large exploratory policy grid and unresolved assay lineage. Distant subsets are nested. Failure of all evaluated distant policies does not prove that no useful policy exists.
A next study should use a separate frozen protocol, choose a candidate policy before new outcomes are observed, and seek an assay-resolved holdout with adequate positive and negative support. That is a distinct computational experiment. The present study supports neither clinical deployment nor a first biological discovery claim.
Reproducibility
The companion research package contains the original audit and follow-up reports, locally frozen protocols and amendments, pinned code and environments, source retrieval manifests, aggregate outputs, claims-to-evidence register and verification receipts. It includes verify_aggregates.py, replay_followup.py and release_diagnostics.py. Follow the included README and upstream conditions to retrieve source inputs and reproduce the analysis.
Raw molecular records, record-level predictions, model checkpoints, private logs and publication machinery are excluded. The original source-license discrepancy remains unresolved; the package does not grant blanket redistribution or commercial-use permission for upstream data.
This report combines the original audit and follow-up studies and incorporates the dated methods addendum. The original study editions are preserved.
Sources and further reading
Primary publications and pinned source repositories used in the audit and follow-up. Numbering corresponds to citations in the text.
- Martins et al. (2012). A Bayesian approach to in silico blood-brain barrier penetration modeling.
- Wu et al. (2018). MoleculeNet: a benchmark for molecular machine learning.
- Sakiyama, Fukuda and Okuno (2021). Prediction of BBBP based on molecular descriptors of free-form and in-blood-form datasets.
- Tong et al. (2022). Blood-brain barrier penetration prediction enhanced by uncertainty estimation.
- Meng et al. (2021). A curated diverse molecular database of blood-brain barrier permeability with chemical descriptors.
- Ferri and Garcia-Gomez (2026). Overrepresentation bias leads to performance overestimation in blood-brain barrier permeability prediction models.
- Schuh, Daniluk and Sieber (2026). Auditing widely used biomolecular benchmarks reveals systematic data inconsistencies.
- Gilmer et al. (2017). Neural message passing for quantum chemistry.
- Kelder et al. (1999). Polar molecular surface as a dominating determinant for oral absorption and brain penetration.
- Tong source repository, pinned revision 5486ab6ab1c14cf5948f2807d3ef7c6529ea60f2.
- B3DB source repository, pinned revision 75dab1cc607bb7a03f3de5c576cffd223e767844.
- Martins deposited supplement metadata.
Publication details
Cite this work
NaS Research (2026). Testing the limits of blood-brain barrier prediction. NaS Research. Version 1.1. https://nasresearch.bio/research/blood-brain-barrier-prediction-audit
Download data and analysisThis report combines the BBB benchmark audit and its controlled and external follow-up. Version 1.1, September 27, 2026. Editorial revision; numerical results and methods are unchanged. Source protocols, aggregate results and analysis code accompany the report.